Prediction and evaluation
PredictionPipeline ties the
mapping, the features and a scikit-learn estimator together.
Fitting
from sklearn.ensemble import GradientBoostingRegressor
from predspot import PredictionPipeline, PandasFeatureUnion
from predspot.crime_mapping import KDE, create_gridpoints
from predspot.feature_engineering import AR, Seasonality, Trend

pipeline = PredictionPipeline(
    mapping=KDE(tfreq="M", grid=create_gridpoints(study_area, resolution=1)),
    fextraction=PandasFeatureUnion([
        ("ar", AR(lags=3)),
        ("seasonal", Seasonality(lags=12)),
        ("trend", Trend(lags=12)),
    ]),
    estimator=GradientBoostingRegressor(random_state=0),
    random_state=0,
)
pipeline.fit(dataset)
fit computes the spatio-temporal series (pipeline.stseries), the feature
matrix (pipeline.features) and trains the estimator on every (t, places)
row whose target is known. Rows are shuffled (random_state) since the
estimator sees them as independent samples.
Evaluating
Periods are ordered and split with scikit-learn's TimeSeriesSplit, so each
fold trains on earlier periods and tests on later ones — no leakage from the
future. One score per fold is returned; the estimator is refitted on all the
data afterwards.
Note
Scores measure how well the density surface of the next period is
predicted at every place. For patrol planning you may care more about the
ranking of places (e.g. hit rate of the top-k cells); compute it from
pipeline.predict() against the series of the following period.
Forecasting
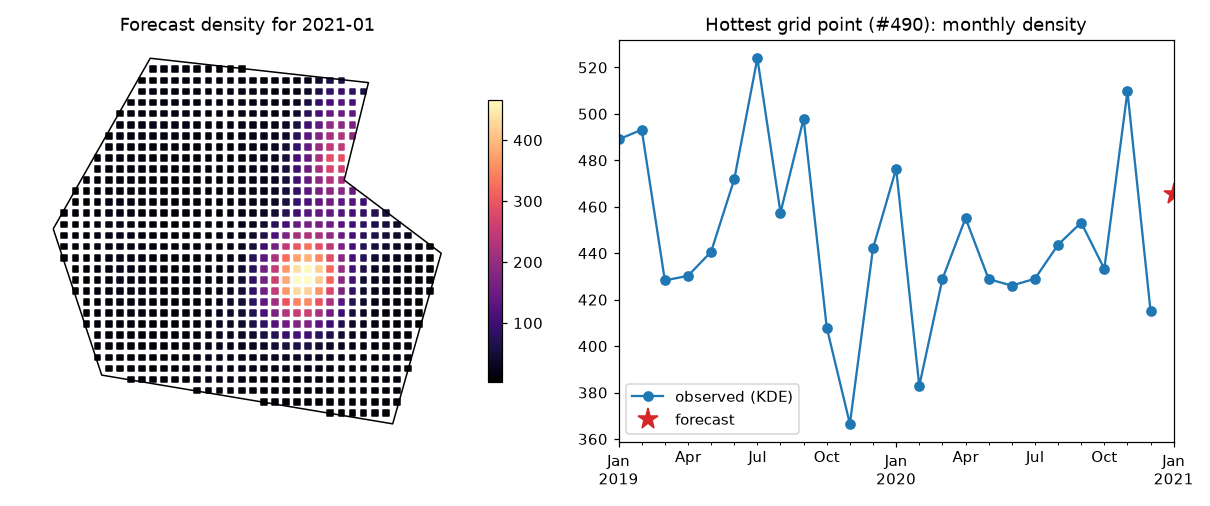
Each predict() call appends its forecast to pipeline.stseries, recomputes
the features and advances pipeline.next_time, so repeated calls produce a
multi-step, recursive forecast. Join the result with pipeline.grid to map
it:
hot = pipeline.grid.join(forecast.droplevel("t"))
top = hot.nlargest(20, "crime_density")     # top-20 places for patrol planning
hot.plot(column="crime_density", cmap="magma", markersize=12, legend=True)
Feature importances
When the estimator (or the last step of a Pipeline) exposes
feature_importances_, pipeline.feature_importances returns them by
feature name, accounting for a FeatureSelection step if present:
Modelling one crime type at a time
Different crime types have different dynamics; the usual approach is one
pipeline per tag:
pipelines = {}
for tag, events in crimes.groupby("tag"):
    pipelines[tag] = build_default_pipeline(study_area).fit(Dataset(events, study_area))
One-call helpers
predspot.pipeline offers
build_default_pipeline (KDE on
points, seasonal/trend/diff features, quantile scaling, RFE selection and a
random forest) and
run_prediction_pipeline, which
also filters by tag and time of day and fits in one go.